Introduction to ESP Insights
ESP Insights (project link: https://github.com/espressif/esp-insights) is a remote monitoring platform that allows users to monitor the health of the device remotely, including warning and error logs, metrics for device operating parameters, device coredump information, and custom data and events.
In this chapter, we will introduce the functions and applications of ESP
Insights based on the esp-insights project. The commit ID is
afd70855eb4f456e7ef7dc233bf082ec7892d9df.
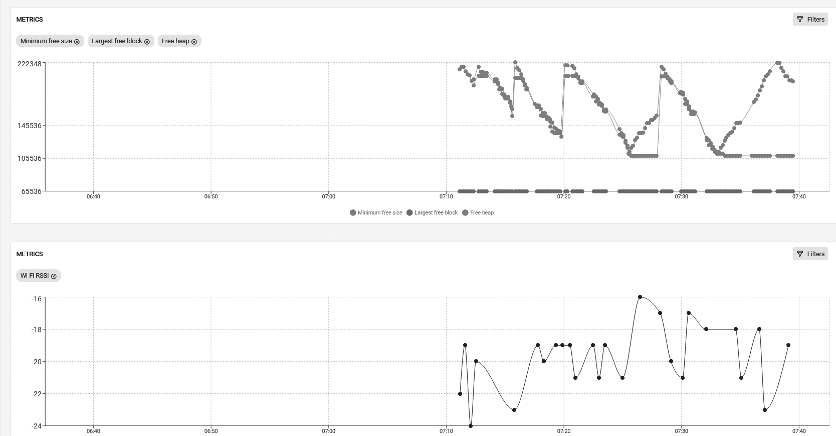
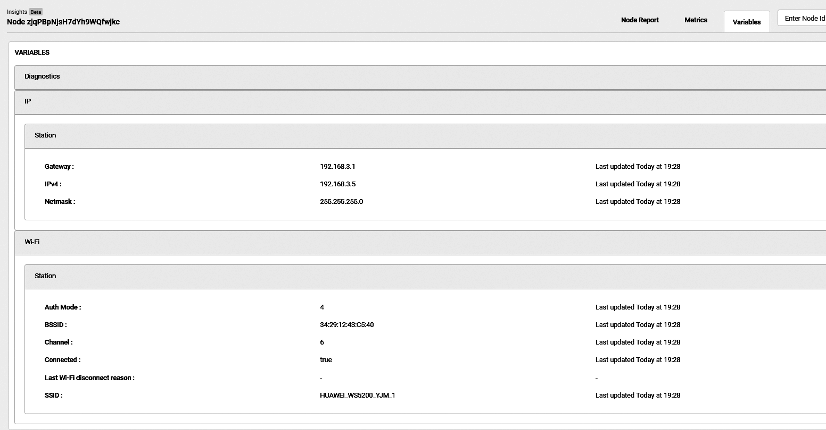
ESP Insights includes a firmware agent, the Insights agent, that captures vital pieces of diagnostics information from the device during runtime and uploads them to the ESP Insights cloud. The cloud then processes this data for visualization. Developers can log in to a web-based dashboard to look at the health and issues reported by their devices in the field. Currently, we only support processing diagnostics information and reports on the ESP RainMaker IoT cloud platform. Support for other cloud platforms will be available in later releases. Figure 15.1 presents the ESP RainMaker IoT cloud platform overview report. Figure 15.2 presents the ESP RainMaker IoT cloud platform metrics report. Figure 15.3 presents the ESP RainMaker IoT cloud platform variables report.
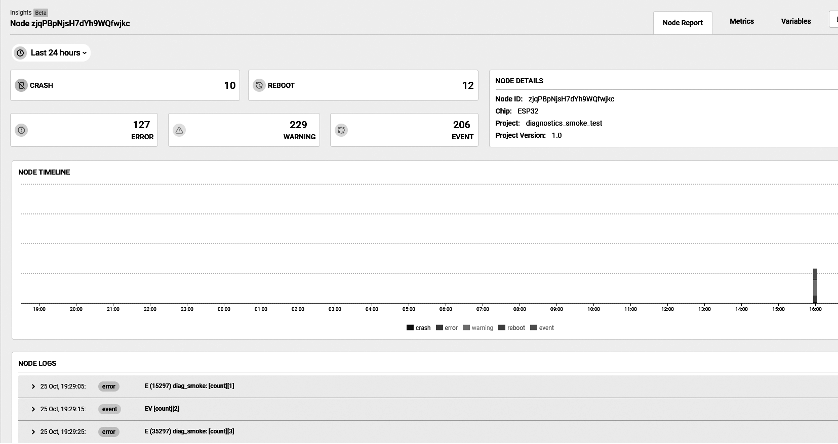
Currently, developers can monitor the following information on the web-based dashboard:
-
Error logs: Outputs by the serial port when the log printing function
ESP_LOGE()is called by components or user applications. -
Warning logs: Outputs by the serial port when the log printing function
ESP_LOGW()is called by components or user applications. -
Custom events: Outputs by the serial port when
ESP_DIAG_EVENT()is called by user applications. Custom events can be used for user-defined data. -
Reset reason: Reasons why the device is reset, e.g., powered on, software reset, brownout, etc.
-
Coredump summary: Register contents and stack backtrace of the offending thread in case of a crash.
-
Metrics: Time-varying data, e.g., the free heap size, the Wi-Fi signal strength plotted over time, etc.
-
Variables: Variable values, e.g., the device's IP address, gateway address, Wi-Fi connection information, etc.
Features of ESP Insights
-
Check device properties (e.g., name, ID, firmware version, etc.) and device status (e.g., memory usage, maximum free block, free heap value, Wi-Fi signal strength, etc.).
-
Check logs generated during device firmware operation, such as error and warning logs, crash backtrace information, reboots, and other custom events.
-
Check the current data reported by the device and generate data sheets according to time.
-
Support customised metrics and variables based on users' needs.
Advantages of ESP Insights
-
Accelerate the development and release of software products.
Beta tests are normally required before releasing any software products officially. During the beta testing, users will provide feedback regarding the performance, stability, reliability, and other problems of the product in real usage scenarios, which will then be handled and fixed by developers. This process often costs developers a large amount of time and effort in locating problems and analysing the causes. With ESP Insights, developers can check the device operation status remotely and obtain the details of abnormal events in a timely manner, saving the time on handling problems greatly and accelerating the software development and release process. ESP Insights also saves the records of abnormal events occurred before the device firmware crashes. After the device is rebooted, it uploads the data to the cloud, thus avoiding losing abnormal information.
-
Handle various firmware problems in a timely manner. For example:
-
Developers can use ESP Insights to check device status (such as available memory space, maximum free block, Wi-Fi signal strength, etc.), analyse the peak value of each metric of the device, and introduce optimisation in future firmware versions.
-
The logs of ESP Insights record the details of all abnormal events, so that developers can handle the abnormality in time before it is detected by the user, preventing any impact of device abnormality on the actual use of the device.
-
-
Data transmission: lightweight, simple, safe, and reliable.
ESP Insights is capable of transmitting diagnostics data using the HTTPS protocol and the MQTT protocol. When working with the ESP RainMaker IoT cloud platform, ESP Insights supports sharing the diagnostics data transmitted over an encrypted channel via the MQTT protocol with the RainMaker IoT Cloud Platform, greatly reducing the memory usage of the device while ensuring the information security. If you are not using the ESP RainMaker IoT cloud platform, you can use the HTTPS protocol alone to transfer the diagnostics data. However, compared with the ESP RainMaker IoT cloud platform, using the HTTPS protocol alone requires adding a TLS link, which will lead to increased memory usage. The data transmitted between the device and the cloud platform is optimised by the CBOR encoding, which significantly saves data transmission bandwidth. In the future, ESP Insights will also integrate device data with the command and control data from the cloud, and pack them into the same MQTT message, further reducing costs with fewer MQTT messages.