Log Debugging
When using the log debugging feature, users need to configure
CONFIG_PM_PROFILING in menuconfig to track the retention time of
each power management lock, then call esp_pm_dump_locks (FILE* stream)
function to print such log. Log debugging allows users to analyse which
power management locks are preventing the chip from entering a low-power
mode and check how much time the chip spends in each power mode. After
debugging, users must disable CONFIG_PM_PROFILING in menuconfig.
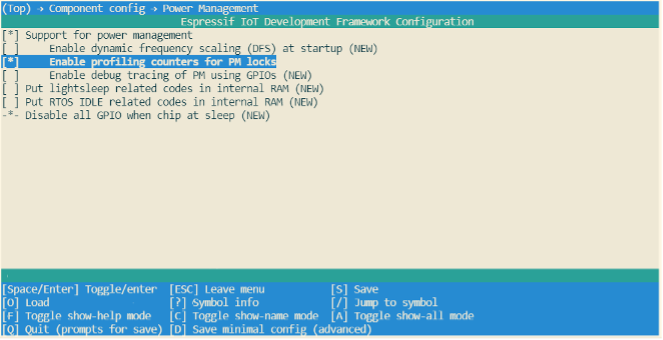
To configure CONFIG_PM_PROFILING, users need to run
idf.py menuconfig command to start the configuration tool, go to
Component config → Power Management, and enable
Enable profiling counters for PM locks. The screenshot of how to
enable the log debugging for ESP32-C3 is shown in Figure 12.5.
When ESP32-C3 is configured to automatically enter Light-sleep mode,
users must call esp_pm_dump_locks (FILE* stream) function periodically
to print debugging log and analyse the root cause of increased power
consumption. Some log debugging information is provided below:
Time: 11879660
Lock stats:
name              type            arg  cnt     times      time      percentage
wifi              APB_FREQ_MAX    0    0        107       1826662   16%
bt                APB_FREQ_MAX    0    1        126       5367607   46%
rtos0             CPU_FREQ_MAX    0    1       8185       809685    7%
Mode stats:
name     HZ        time     percentage
SLEEP     40M      4252037  35%
APB_MIN   40M            0   0%
APB_MAX   80M      6303881  53%
CPU_MAX  160M       823595   6%
The esp_pm_dump_locks (FILE* stream) function prints two types of
debugging information, namely the Lock stats and Mode stats. The
Lock stats section lists the real-time status of all power management
locks used by the application with the following information: Name
(name), type of power management lock (type), parameter (arg),
number of times the power management lock is currently acquired (cnt),
total number of times the power management lock is acquired (times),
total amount of time the power management lock is acquired (time), and
the proportion of time when the power management lock is acquired
(percentage). The Mode stats section lists the real-time status of the
application's different modes with the following information: Mode name
(name), clock frequency (HZ), total amount of time in the mode
(time), and percentage of the amount of time in the mode
(percentage).
By checking the example log above, users can easily find out that, for
the Wi-Fi power management lock APB_FREQ_MAX,
- this lock is currently not acquired,
- the total amount time when this lock was acquired is 1826662 μs,
- the total number of this lock being acquired is 107 times,
- and the proportion of time when this lock was acquired is 16%.
Similarly, users can also know the rtos0 power management lock CPU_FREQ_MAX:
- is currently being acquired,
- the total amount time when this lock was acquired is 809685 μs,
- the total number of this lock being acquired is 8185 times,
- and the proportion of time when this lock was acquired is 7%.
Also, users can read log information about the Mode stats in a similar way. For example, in Sleep mode the clock frequency is 40 MHz, and the total time in this mode is 4252037 μs, accounting for 35% of the whole time. Similarly, users can read the log for other locks and states themselves.